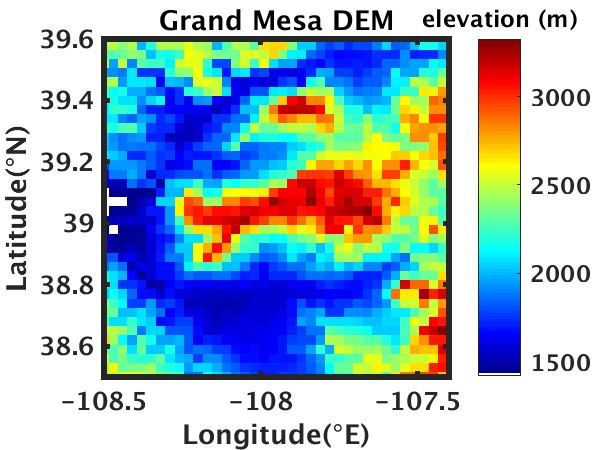
Downscaling of HRRR Precipitation Rate over Grand Mesa, CO
Authors: Mochi Liao and Ana P. Barros
The HRRR data set has original spatial and temporal resolution of 3 km (0.03 degree) and 1 hour. Three hourly products at spatial resolution of 1.5 km, 750 m, and 375 m using the same fractal downscaling techniques used in developing IPHEx V1.0 data sets (Nogueira and Barros, 2015; Liao and Barros, 2019).
The study region covers the Grand Mesa area as shown in the map below. In the original dataset, the upper left corner pixel (1, 1) is located at -108.5W, 38.5N and the upper left pixel location remains the same in the downscaled products. Latitudes increase as row index increases and longitude increases as column index increases. For example, data point (2, 2) is located at -108.47W, 38.53N.
The data sets provided here are precipitation rate data sets. One can determine if a pixel is either snowfall rate or rainfall rate by applying the criterion of 273.15K. For example, if the temperature at a pixel is greater than 273.15K, then the data at that pixel represent rainfall rate; if the temperature at a pixel is less than 273.15K, then the data at that pixel represent snowfall rate.
1. Naming conventions regarding downscaled products
Dates are in UTC. Two important variables in each mat file:
- Dws: ensemble mean of 50 replicates. Dimensions (#rows, #columns)
- dws: individual replicates. Dimensions: (50,#rows, #columns)
Example:
20170201_01data#.mat is the downscaled data from 01h to 02h (UTC) on 20170201 with a resolution of 3/# km. For instance, if # is 8, then the resolution is 3/8 km = 375m (0.00375 degree); if # is 4, then the resolution is 3/4 km = 750m (0.0075 degree); if # is 2, then the resolution is 3/2 km = 1500m (0.015 degree).
Latitudes increase as row index increases and longitude increases as column index increases. For example, if the # is 4, the upper left corner pixel (1, 1) is located at (-108.5W, 38.5N). Data point (2, 2) is located at (-108.4925W, 38.5075N).

2. Current Data Availability
This is to be updated as more processing is concluded.
Present Date - August 2019
Availability – February 2017
In processing – September 2016 - June 2017
Missing Data – February 28, UTC Hour: 16,17,18,19
References
Nogueira, M., and Barros, A.P., 2015: Transient Stochastic Downscaling of Quantitative Precipitation Estimates for Hydrological Applications. J. Hydrology, No. 529, 1407-1421. DoI:10.1016/j.jhydrol.2015.08.041.
Liao, M. and Barros, A.P, 2019: The Integrated Precipitation and Hydrology Experiment – Hydrologic Applications for the Southeast US (IPHEX-H4SE). Part IV: High-Resolution Enhanced StageIV-Raingauge Combined Precipitation Product. Duke University, Environmental Physics Laboratory, Report EPL-2019-IPHEX-H4SE-4, 28pp. DoI: http://dx.doi.org/10.5067/GPMGV/IPHEX/GAUGES/DATA401